Seasonality
Promos
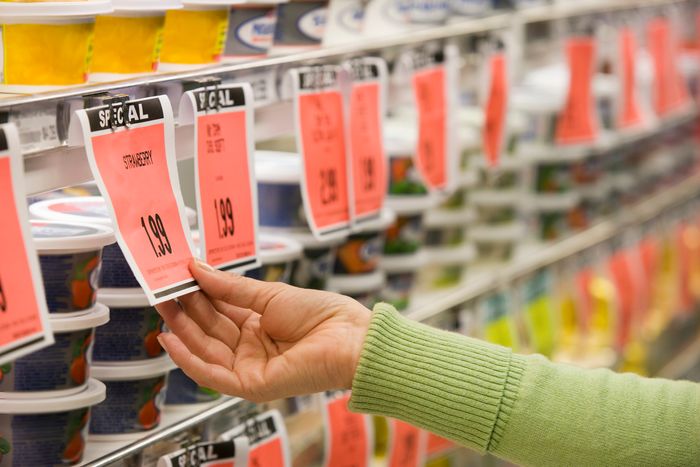
Pricing
Test Image
AI Software For Every Retail Challenge
For 35 years, Churchill Systems Inc. has been providing AI-based machine learning software for every aspect of the retail life cycle. From Merchandise Planning to Supply Chain, to Pricing and Promotions, Churchill has the software to propel your existing systems to the next level.
Click on the Retail Wheel to learn more about Churchill’s unique software solutions.
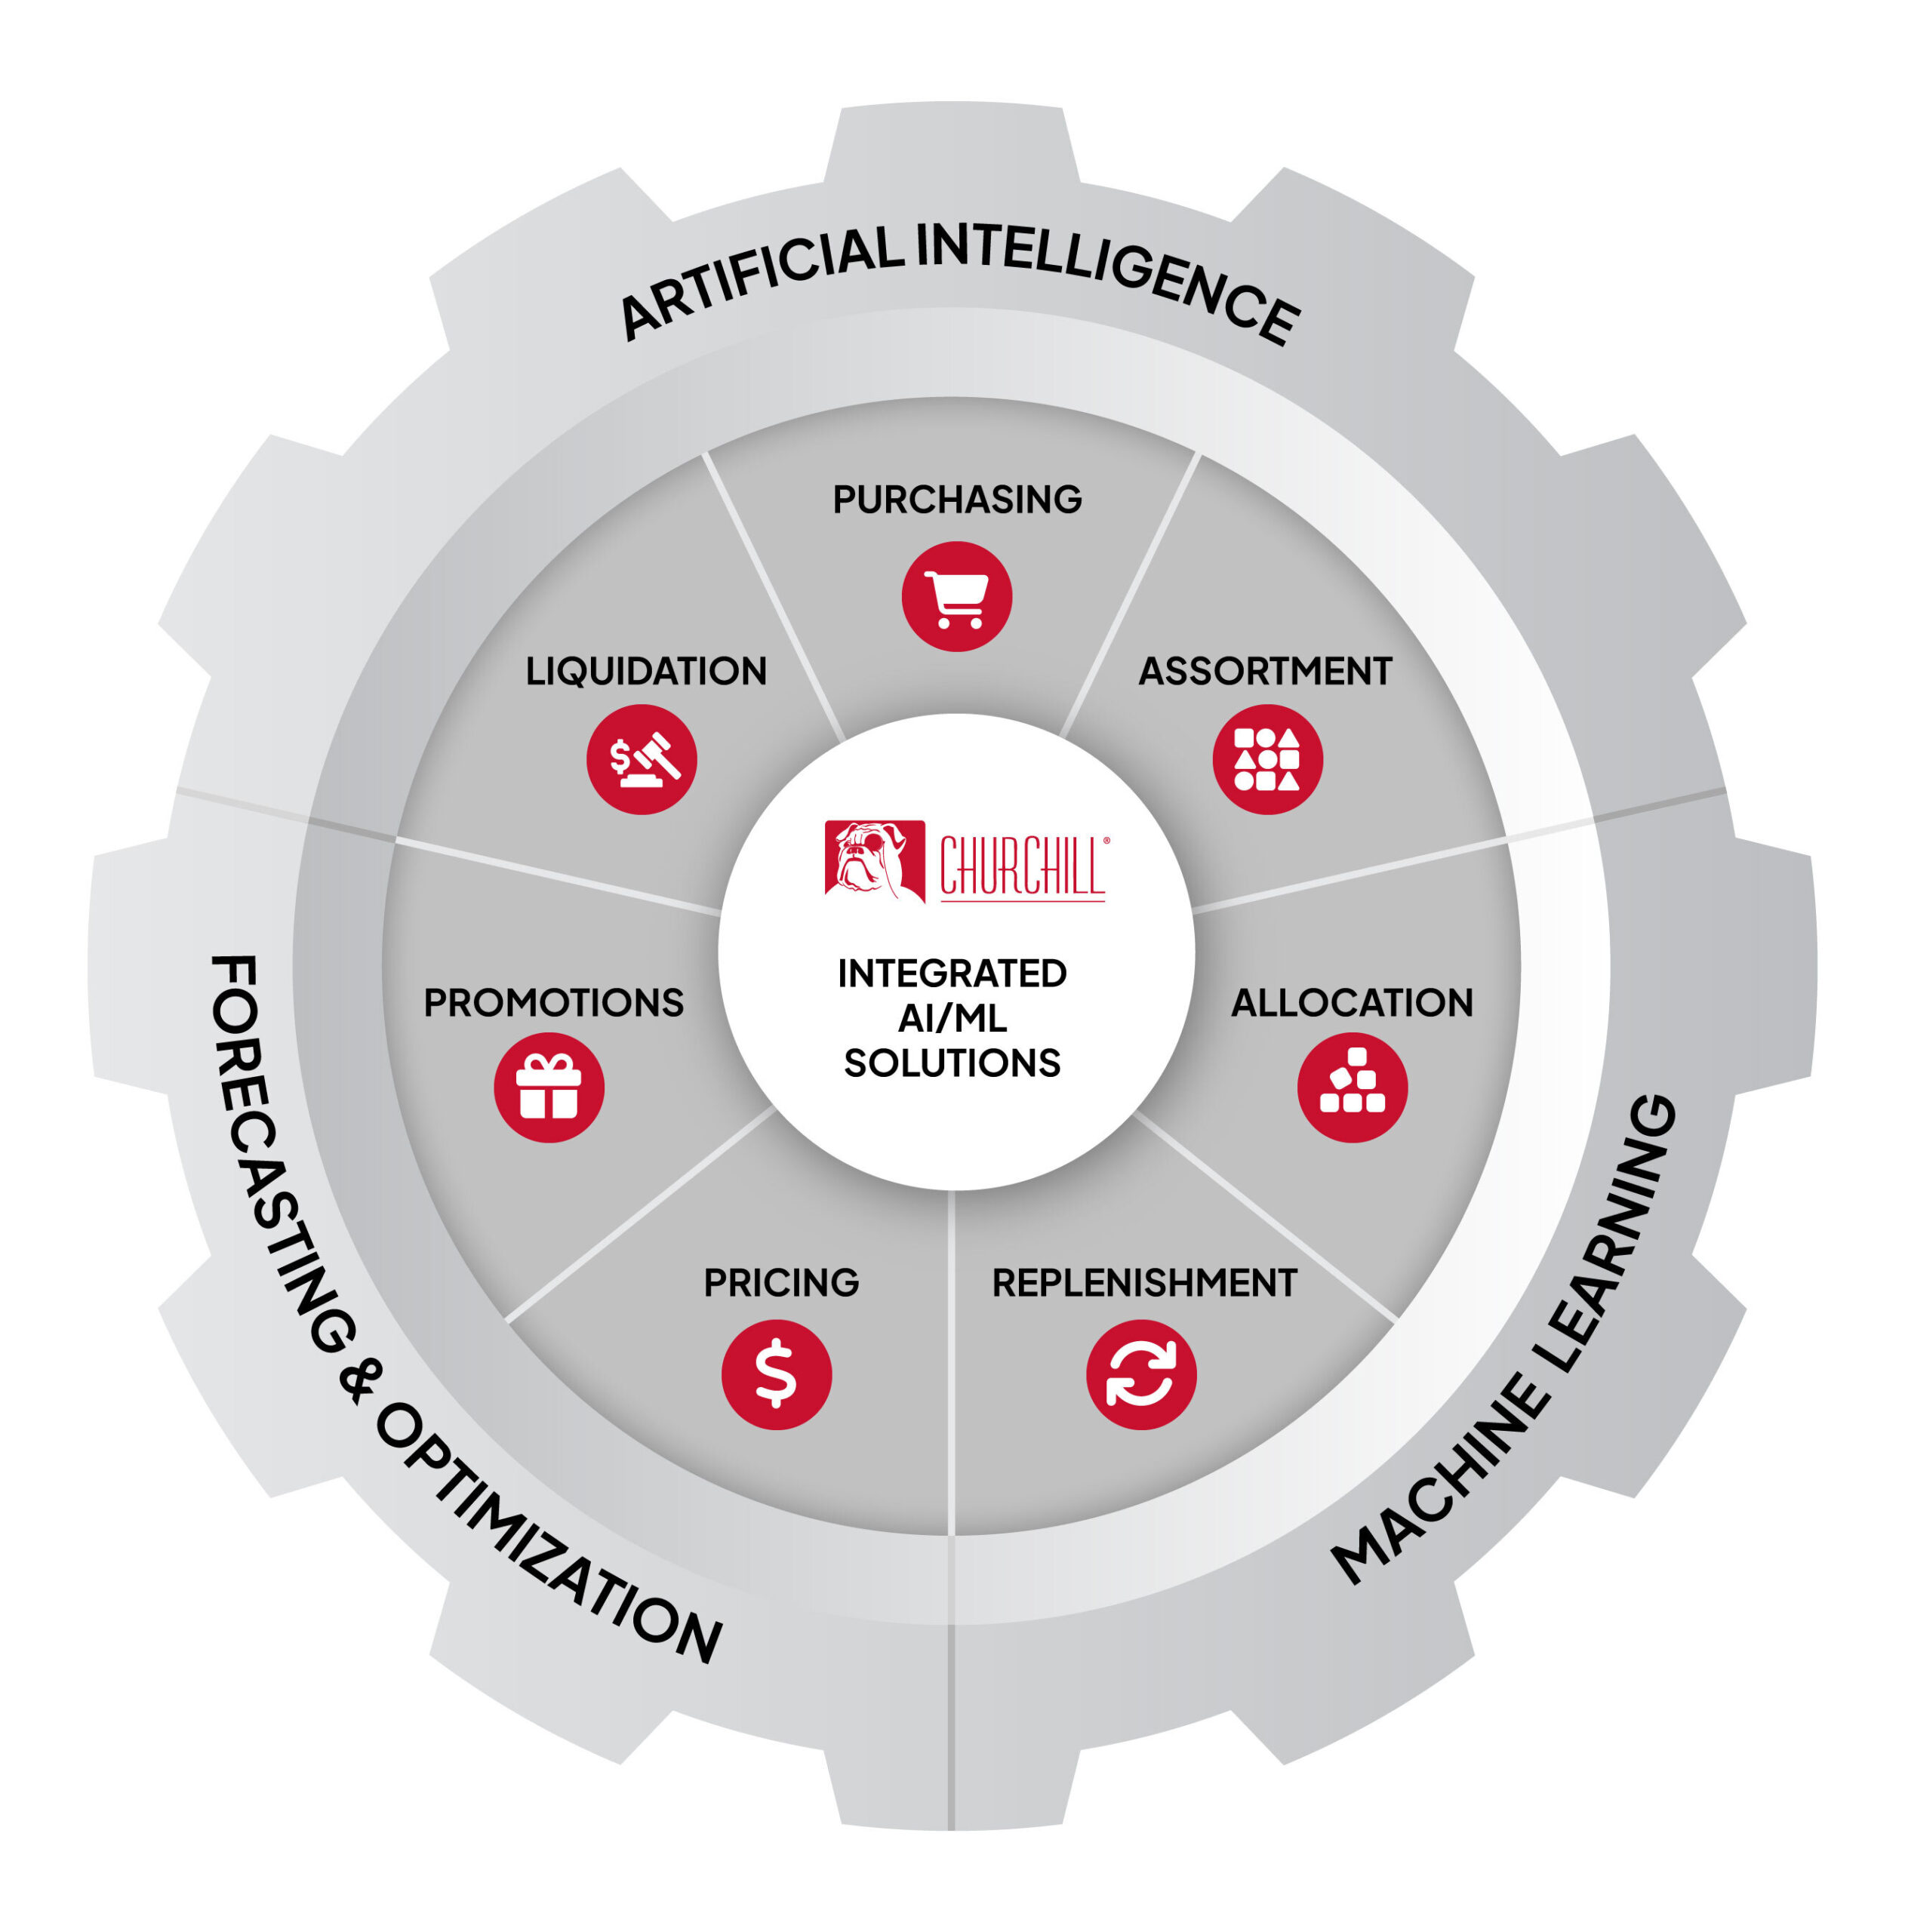
Purchasing
Legacy systems often determine volume using last year’s sales figures. With Churchill AI, get recommendations for Total Buy quantities based on upcoming customer demand.
Assortment

Often times finding the right mix of products, styles and sizes is done through trial and error. Churchill AI analyzes demand history to optimize Assortments by location throughout the year.
Allocation

Proper distribution of product across locations is key to high customer service levels and a profitable category. Demand-based Allocation reduces out of stocks and ensures that each location maximizes potential sales at the sku level.
Replenishment

A reliable demand forecast is the foundation of a sound replenishment system. Churchill combines detailed seasonal profiles with dynamic algorithms to produce a high volume, basic item forecasting application for everyday items.
Pricing
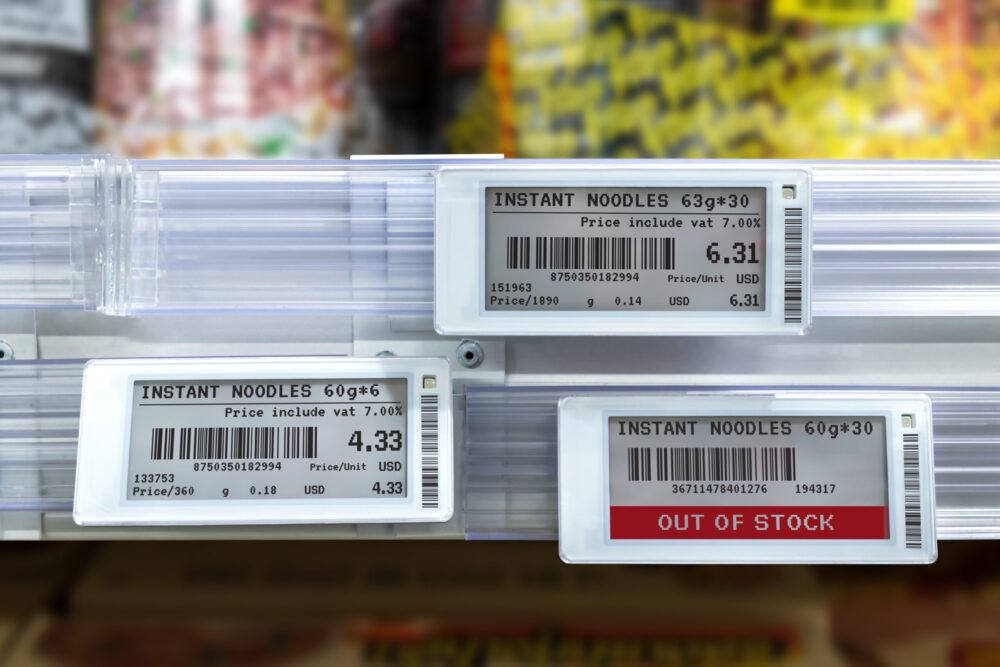
Each segment of a product’s lifecycle has its own unique pricing challenges. From new item introduction, to regular pricing, markdown optimization and clearance, Churchill’s Machine Learning software optimizes pricing every step of the way.
Promotions

Today’s promotion are complex activities that involve dozens of unique scenarios. Churchill AI-based Neural Network technology considers 30+ factors to generate sku-level forecasts.
Liquidation

From Markdowns to Clearance, each item has its own objectives and goals to reach. Churchill AI optimizes each forecast and price recommendation at the sku level to meet end-of-season goals at a granular level.